Overview
The All devices page is a center piece of the Agrimesh Console. This is the place your devices appear once they are powered and communicate with the Hub. By default, you will find them in the empty location section at the bottom. While some devices are in function as they get powered on, some need a bit of a configuration.
To access the All devices page, simply log in the Agrimesh Console, find the hamburger menu to the far left of the top green ribbon and select All devices.
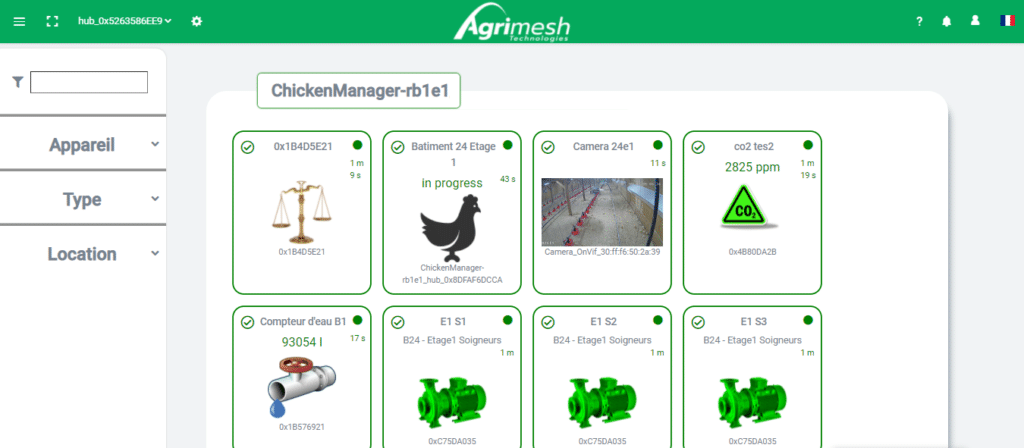
On the left, it is possible to filter your devices by device, device type or location. This helps quickly find a device you are looking for. The rest of the page is dedicated to the different devices in the barn. They are seperated by the location they are configured in. For instance, the location in the picture below is ChickenManager-rb1e1. This name is arbitrary. It could be Barn-1, South Barn, or whatever is more meaningful to you. If the location of a device is wrong, please have a look at how to configure a location.
For a specific device
In this section, we will go over the information that is displayed for a given device. While some devices have some specifics, they all share a common baseline. That is what we will go over for now by refering to the images below.
Starting from the top left, the circle with a check in it represents the state in which the device is currently operating.
The automatic mode means the Agrimesh system is controlling the device. In manual mode, you can turn the device on or off and it will remain this way until it is manually toggled again or until it is put back in automatic mode. If the circle is red, the device is disabled and it will not be used.
| Couleur | Signification |
|---|---|
| Green | Operates in automatic mode |
| Yellow | Operates in manual mode |
| Red | Device is disabled |
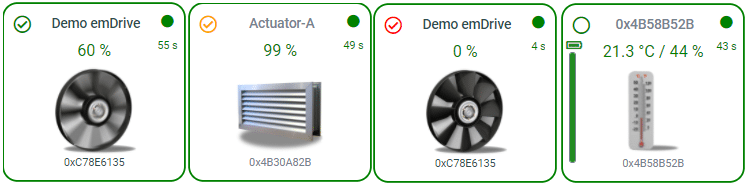
Some devices will also have a battery gauge on the left of the green rectangle. Those devices are limited to emBreaths and emBreezes. When the gauge is empty, the battery should be changed.
In the middle part of the rectangle, we find the name of the device at the top. Underneath, there is the state or the readings of the device, depending on the device. For anything controlled by a drive, we’ll find the percentage at which the device is running. For an emActuator, the percentage represents how open the inlets are. The emBreath displays the temperature and the humidity percentage.
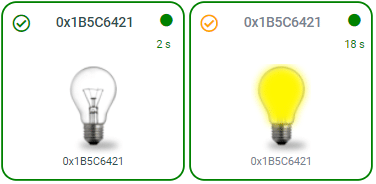
For devices controlled by an emPowerR3 (on/off), the image in the center represents the state of the device. For instance, you can refer to the light bulb to know whether your lights are turned on or turned off.
Then the top right of the rectangle is occupied with a green or a red dot. This represents the status of the communication of the device to the Hub. If the dot is green, the communication is good. If the dot is red, it means that this particular device has not communicated with the Hub for a longer delay. Quite often, this is in someway related to a power issue. Making sure the device has electricity powering it or flipping the breaker may restore proper communication to the device.
How long since the last communication? That is where the number underneath the dot comes in. This timer increments every second since the last communication. Ideally, it should not go beyond two minutes. A timer that sometimes go beyond two minutes can be tolerable, but if it occures frequently, there may be something wrong with the Internet connexion or something physical interfering the communication around the device. This should not be taken lightly, please contact our support if you cannot restore proper communication to the device.
See also: